The Sydney CBD office market is considered Australia’s most liquid and mature office market. It accommodates headquarters of financial institutions, professional services, and increasingly information technology.
Over the last cycle, the market experienced the withdrawal of state government departments to Parramatta. The ownership profile is dominated by institutional capital – Australian/overseas REITs, private institutional capital, and sovereign wealth funds. In recent times, the infrastructure developments including the completion of Sydney Light Rail and the construction of four new Metro stations (due 2024 and 2030) will continue to enhance Sydney CBD’s connectivity.
The key issue for Sydney CBD is how the improving physical occupancy (Sydney PCA Occupancy Rate Mar-22: 41%) will impact upon Sydney CBD occupier/capital markets.
Sydney CBD Office Indicators
| Indicator | Jan 2020 | Jul 2020 | Jan 2021 | July 2021 | Jan 2022 |
| Total Stock (m²) | 4,985,833 | 4,877,938 | 5,082,117 | 5,149,548 | 5,162,626 |
| Vacancy Rate (%) | 3.9 | 5.6 | 8.6 | 9.2 | 9.3 |
| Annual Net Absorption (m²) | -46,252 | -98,290 | -110,346 | -26,372 | 33,111 |
| Net Supply (m²) | -32,057 | -75,838 | 204,179 | 67,431 | 13,078 |
| Av. A Grade Gross Face Rent | $1,100 | $1,100 | $1,100 | $1,100 | $1,100 |
| Average A Grade Incentive | 18.5% | 27.5% | 32.5% | 35% | 35% |
| Average A Grade Initial Yield | 4.875% | 4.875% | 4.875% | 4.875% | 4.875% |
Source: Property Council of Australia (PCA) & Acumentis Research
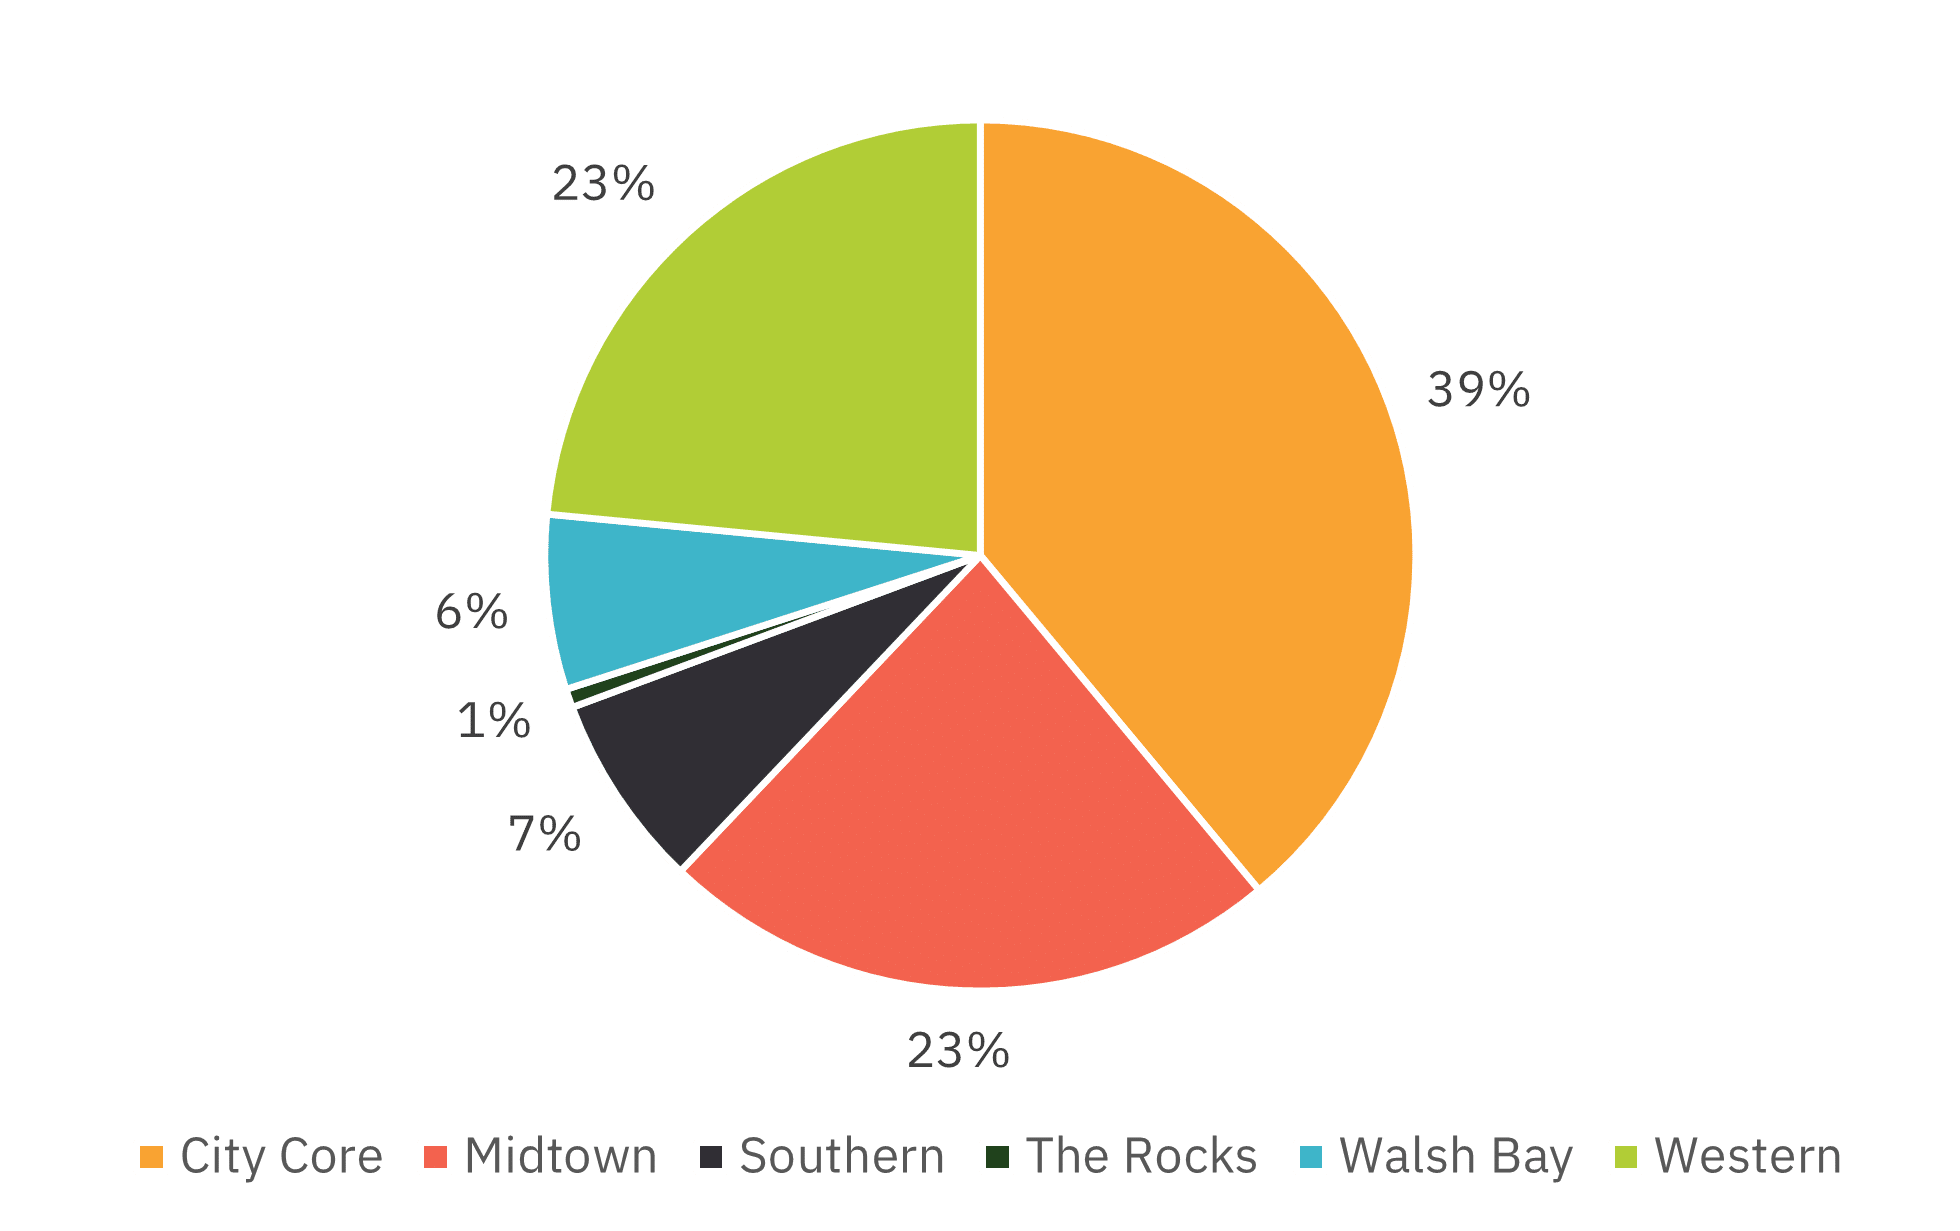
Sydney CBD – Stock Composition by Grade (m2)

Sydney Office Stock – Jan 2022
The Sydney CBD office supply cycle is emerging with the recent completion of Brookfield Place, together with projects under construction: Quay Quarter Salesforce Tower, 210 George Street, Parkline Place, and refurbished projects (255 George Street). The current supply cycle (2020-24) will deliver nearly 532,000m2 of new and refurbished stock to the market, similar in magnitude to the 2015-2018 cycle (568,000m2 new stock delivered). Stock withdrawals over the near term will be limited to 33 Alfred Street and those associated with the Metro West – equating to some 56,700 m2 over 2022.
Major Sydney CBD Office Projects
| Project | Type | NLA (m2) | Pre-com | Timing | Developer |
| Quay Quarter | New | 88,274 | 85% | 1H 2022 | AMP/Rest |
| 255 George Street | Refurb | 19,000 | (*) | 1H 2022 | AMP |
| 210 George Street | New | 16,500 | 33% | 2H 2022 | Poly |
| Salesforce Tower | New | 56,478 | 49% | 2H 2022 | LLC (et al) |
| 65-77 Market Street | New | 12,000 | 0% | 1H 2023 | Scentre/Acquland |
| 33 Alfred Street | Refurb | 32,353 | 0% | 1H 2024 | AMP |
(*)to be confirmed
Source: Acumentis, Property Council of Australia
Overall demand has been constrained owing to the pandemic as occupiers contemplate how structural changes in the hybrid working model will play out in their workplace strategies and take up. To this end, the market recorded some 150,000m2 of negative net absorption over July 2019 to January 2021. Accordingly, occupier demand has subsequently stabilised, with a rebound in white collar employment having seen an increase in inquiries and deal flow, particularly in the sub 500m2 sector. Demand is broad based (financial, IT, fintech and professional services). A key demand driver has been the “flight to quality” incorporating building well-being, market amenity and fit out. The impact of subleasing upon the broader market is moderating (sublease vacancy Jan-22: 1.0 % v peak of 1.7% recorded in Jan-21). Accordingly, the market experienced positive net absorption of some 33,000 m2 over 2021 – the highest reading since 2016.
Sydney CBD, Net Absorption by Grade (‘000 m2)

Source: Property Council of Australia
Given the expected rebound in hiring (Deloittes are forecasting a record-high of 15,131 in white collar jobs created over 20220/23) the settings are generally accommodative for an expansion in demand over the near term.
Rents
Rental metrics remained stable over the past 12 months , as summarised below:
Sydney CBD Rental and Incentives , Mar-21
| Grade | Net Face Rents | Gross Incentives |
| Premium | $1,425 (+0.0%) | 35% (+0.0%) |
| Grade A | $1,145 (+0.0%) | 35%(+0.0%) |
| Grade B | $845 (+0.0%) | 35% (+0.0%) |
( ) denotes 12 month change
Source: Acumentis
Sydney CBD – Net Face Rents ($/m2)

Source: Acumentis
We consider that face rental growth will emerge from Q3 2022 as demand expands with rental growth peaking from 2025. The risk around rental growth will relate to new supply, ongoing pandemic uncertainty and the higher than anticipated adoption of hybrid work practises. In terms of vacancy risk, this seems to have moderated with a 9.3% reading at January 2022 (Jul-21: 9.2%) and compares to a cycle low of 3.5% in July 2019.
Sydney CBD Vacancy
| Grade | Jan-22 (%) | 5 Year Average (%) |
| Premium | 4.9 | 5.1 |
| Grade A | 10.8 | 5.8 |
| Grade B | 11.3 | 6.8 |
| Total | 9.3 | 6.0 |
With new supply peaking over 2022 (183,000m2) vacancies are expected to peak over 2022 – possibly as high as 11% depending upon backfill vacancy/withdrawals.
It is expected that vacancies will decline as demand expands and the supply cycle matures.
In terms of the investment yield profile, liquidity returned to capital markets over 2011/22 with a number of trophy transactions trading including partial interests in 1 Bligh Street, 200 George Street, Grosvenor Place and Darling Square. The sell-side includes global capital and Australian REIT’s looking to lock-in capital gains and recycle stock to development projects. Whereas the buy-side takes in Australian REIT’s/private capital looking to increase their Sydney presence and global (Insurance/pension) capital seeking to secure covenant profiles.
Major Sydney CBD Sales , 2021-22
| Grade | Price ($m) | Cap Rate | Purchaser | Vendor | Date |
| 200 George Street (50%) | $578 | 4.27% | Mirvac/M&G | AMP | Aug-21 |
| 383 Kent Street | $385 | 5.00% | Charter Hall | Dexus | Nov-21 |
| 77 Castlereagh Street | $250 | 4.58% | Abacus | Blackstone | Dec-21 |
| 309-321 Kent Street (50%) | $401 | 5.10% | Ashe Morgan/Liu Chong Hing | Dexus | Dec-21 |
| 10 Barrack Street | $211 | 4.69% | Shayer | AEW | Jan-22 |
| Darling Quarter (50%) | $625 | 4.25% (*) | Allianz/NPS | ADIA | Jan-22 |
( ) Reported
Source: Acumentis
Despite increased liquidity, investment metrics remain stable, as summarised below:
Sydney CBD Investment Metrics , Mar-21
| Grade | Cap Rate | IRR |
| Premium | 4.25 – 4.75% (+0.0%) | 5.50 – 6.00% (+0.0%) |
| Grade A | 4.50 – 5.25% (+0.0%) | 5.75 – 6.50% (+0.0%) |
| Grade B | 5.00 – 5.50% (+0.0%) | 6.25 – 6.75% (+0.0%) |
( ) denotes 12 month change
Source: Acumentis
We consider that investment metrics will remain broadly stable given recent rates movements - the potential for reperforming occupier markets is seen as the key driver for cap rate compression as shown in the graph below:
Fig 10. Sydney CBD Cap Rates
Overall, in more recent times, improved market sentiment and economic conditions have led to a modest uptick in demand across the CBD. The demand is being led by the tech and financial services sectors, particularly within the public sector. There is a renewed sense that the level of inquiry and demand is now returning to pre-pandemic levels.